Thursday, December 25, 2014

Processing GeoTiff files in .NET (without using GDAL)

I've recently created a process that is able to import geoferenced raster data, namely GeoTiff files... with a catch:
As I didn't find a proper lib to load GeoTiff files I was converting the source files to an ASCII Gridded XYZ format prior to importing. Despite the fancy name it's simply an ASCII file where each line contains:
<LONGITUDE>     <LATITUDE>      <VALUE1>   [ <VALUE 2>]   [<VALUE 3>]
Each line on this file corresponds to a pixel on a raster image, thus it's incredibly easy to parse in C#. The code would be something like this:
foreach (var line in File.ReadLines(filePath))
{
    if (line == null)
    {
        continue;
    }

    var components = line.Split(
        new[] { ' ' }, 
        StringSplitOptions.RemoveEmptyEntries);

    var longitude = double.Parse(components[0]);
    var latitude = double.Parse(components[1]);

    IEnumerable<string> values = components.Skip(2);

    //... process each data item

    yield return dataItem;
}

Nice and easy. But this has two disadvantages:

First, it requires an extra step to convert to XYZ from Geotiff, although easily done with the GDAL:
gdal_translate -of XYZ <input.tif> <output.xyz>
Another disadvantage is that the XYZ becomes much larger than its TIFF counterpart. Depending on the source file the difference could be something like 10 GB vs 500 MB (yes, 50x bigger)

So, I would really like to be able to process a GeoTiff file directly in c#. One obvious candidate is using GDAL, particularly its C# bindings. Although these bindings work relatively well they rely on an unmanaged GDAL installation. For me this is a problem as I want to host this on Azure WebSites, where installing stuff is not an option.
So, I embraced the challenge of being able to process a GeoTIFF file in a fully managed way.


Wednesday, December 10, 2014

Splitting vector and raster files in QGIS programmatically

On the context of the game I'm developing I have to load gigantic .shp/.tif files and parse them to hexagons.

The problem is that this operation is executed in memory (because I need to consolidate/merge data) and the process fails with large files. I had two options:
  • Change the process so that it would store the preliminary results on a separate datastore
  • Instead of loading full shapefiles or raster images, split them into smaller chunks
I did try the first option and, although working, became so much slower (like 100x) that I had to discard it (or at least shelve it while I searched for a better alternative).

I also tried the smaller chunks approach and started by creating "packages" per Country, manually picking data from sources such as Geofabrik.

But this posed two problems:
    • Very tedious work, particularly as there are hundreds of countries.
    • Wouldn't work for larger countries, hitting the memory roadblock as well.
So I opted to split the files in a grid like manner. I decided to use QGIS as it provides all the required tooling.  

Doing this splitting is quite easy to do manually:

1. Open the shapefile (For this example I'm using Countries data from NaturalEarth).


2. Generate a grid.
  • Open the toolbox

  • Choose Geoalgorithms > Vector > Creation > Create graticule
  • Set the desired size (in degrees per rectangle) and set Grid type to Rectangle (polygon)

  • A grid is created over the map (I've changed the opacity of the grid layer to show the map beneath).

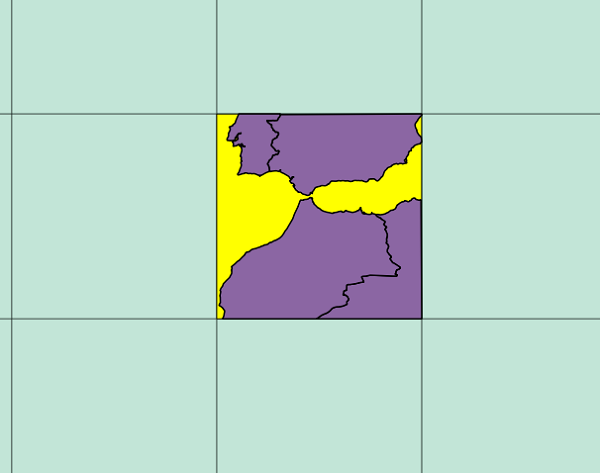
3. Select one of the rectangles


4. Perform an intersection between both layers
  • Choose Vector > Geoprocessing Tools > Intersect

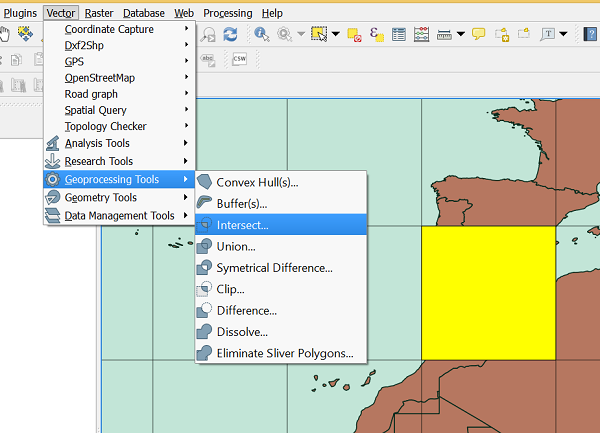
  • Choose the base layer as input and the rectangle as the intersect layer, using the "Use only selected features" option.
  • After executing a new layer is created with the intersecting polygons


Now I would just need to repeat this for all the 648 grid items x number of layers to process. I'm assuming this would take about 1 minute per each one and about 10 layers. So, approximately 108 hours non-stop... Not going to happen :). So, what about automating this inside QGIS?

QGIS does provide a command-line/editor/plugins to programmatically leverage its functionalities. Unfortunately for me, it's in Python, which I had never used before. Regardless, the optimistic in me jumped at the opportunity to learn something new.

So, here it is, a sample Python script for QGIS that basically mimics the manual steps I did above:
  • Generates a grid (size hardcoded)
  • Iterates the various tiles in the grid
    • Iterates all layers currently visible (both raster and vector)
      • Outputs the intersection between the layer and the tile
      • Creates a subfolder (harcoded) with all the intersected layers for each tile.
Complete code (update: there's a newer implementation on the bottom)

import processing
import os

#Create a GRID
result = processing.runalg("qgis:creategrid", 1, 360, 180, 10, 10, 0, 0, "epsg:4326", None)

#Add it to the canvas
gridLayer = iface.addVectorLayer(result.get("OUTPUT"),"grid","ogr")

#Iterate ever square on the grid
i = 0
for square in gridLayer.getFeatures():
    i = i + 1
    
    #Create a new layer
    newSquareLayer = iface.addVectorLayer("Polygon?crs=epsg:4326", "temporary_polygon_" + str(i), "memory")        
    provider = newSquareLayer.dataProvider()

    #feature that simply holds one square
    newSquare = QgsFeature()
    newSquare.setGeometry( QgsGeometry.fromPolygon(square.geometry().asPolygon()))
    provider.addFeatures( [ newSquare ] )

    #Make sure the target folder exists
    folder = "c:\\temp\\grid\\grid_" + str(i) 
    if not os.path.exists(folder):
        os.makedirs(folder)

    #iterate the various layers except the grid
    for mapLayer in iface.mapCanvas().layers():
        
        layerType = mapLayer.type()
        layerName = mapLayer.name()
        intersectionName = "intersection_" + layerName + "_" + str(i)

        #vector layers and raster layers are processed differently
        if layerType == QgsMapLayer.VectorLayer and layerName != "grid":
        
            #Calculate the intersection between the specific grid rectangle and the layer
            intersection = processing.runalg("qgis:intersection", mapLayer, newSquareLayer, None)

            iface.addVectorLayer(intersection.get("OUTPUT"),intersectionName,"ogr")
            
            #create a shapefile for this new intersection layer on the filesystem. 
            #A separate folder will be added for each square
            intersectionLayer = QgsMapLayerRegistry.instance().mapLayersByName(intersectionName)[0]
            QgsVectorFileWriter.writeAsVectorFormat(
                        intersectionLayer, 
                        folder + "\\" + layerName + ".shp", 
                        "utf-8", 
                        QgsCoordinateReferenceSystem(4326), 
                        "ESRI Shapefile")

            #remove the intersection layer from the canvas
            QgsMapLayerRegistry.instance().removeMapLayers( [intersectionLayer.id()] )
                
        elif layerType == QgsMapLayer.RasterLayer:
            
            #Calculate the intersection between the specific grid rectangle and the raster layer
            intersection = processing.runalg('saga:clipgridwithpolygon', mapLayer, newSquareLayer, None)
            
            #add the intersection to the map
            iface.addRasterLayer(intersection.get("OUTPUT"), intersectionName)

            #export to file
            intersectionLayer = QgsMapLayerRegistry.instance().mapLayersByName(intersectionName)[0]
            
            pipe = QgsRasterPipe()
            provider = intersectionLayer.dataProvider()
            pipe.set(provider.clone())
            
            rasterWriter = QgsRasterFileWriter(folder + "\\" + layerName + ".tif")
            xSize = provider.xSize()
            ySize = provider.ySize()
            
            rasterWriter.writeRaster(pipe, xSize, ySize, provider.extent(), provider.crs())
            
            #remove the intersection layer from the canvas
            QgsMapLayerRegistry.instance().removeMapLayers( [intersectionLayer.id()] )
            
        else:
            print "layer type not supported"
    
    #Now that all the intersections have been calculated remove the new square
    print "Removing temporary grid item " + str(i) + "(" + newSquareLayer.id() + ")"
    QgsMapLayerRegistry.instance().removeMapLayers( [newSquareLayer.id()] )
    
#Remove the grid
QgsMapLayerRegistry.instance().removeMapLayers( [gridLayer.id()] )
To use this script:
  • Open the Python console:
  1. Open the editor and copy&paste the script there
  2. Save the script
  3. Execute it

Could take a couple of minutes for large files, particularly the raster ones, but at least it's automatic.


Update (11/12/2014)

Although the above script worked as planned, the import process didn't, particularly on the data between the generated tiles. As there's no overlap on the clipped data, after processing small gaps would appear on the end-result. Thus, I've created a brand new implementation that is a little bit more polished and supports a new "buffer" parameter. This allows the tiles to overlap slightly like:
Also, the grid is now created programmatically without using "creategrid" function, which also allowed me to use a more logical X,Y naming for the tiles.

The new code is:
import processing
import os

#######  PARAMS  #######

originX = -180
originY = 90

stepX = 10
stepY = 10

width =  360
height = 180

iterationsX = width / stepX
iterationsY = height / stepY

buffer = 1

j = 0
i = 0

targetBaseFolder = "C:\\temp\\grid"

#######  MAIN   #######

for i in xrange(0,iterationsX):
    
    for j in xrange(0,iterationsY):
        
        tileId = str(i) + "_" + str(j)
        
        folder = targetBaseFolder + "\\" + tileId
        
        if not os.path.exists(folder):
            os.makedirs(folder)
        
        print "Processing tile " + tileId

        minX = (originX + i * stepX) - buffer
        maxY = (originY - j * stepY) + buffer
        maxX = (minX + stepX) + buffer
        minY = (maxY - stepY) -  buffer

        wkt = "POLYGON ((" + str(minX) + " " + str(maxY)+ ", " + str(maxX) + " " + str(maxY) + ", " + str(maxX) + " " + str(minY) + ", " + str(minX) + " " + str(minY) + ", " + str(minX) + " " + str(maxY) + "))"

        tileLayer = iface.addVectorLayer("Polygon?crs=epsg:4326", "tile", "memory")
        provider = tileLayer.dataProvider()
        tileFeature = QgsFeature()

        tileFeature.setGeometry(QgsGeometry.fromWkt(wkt))
        provider.addFeatures( [ tileFeature ] )
        
        for mapLayer in iface.mapCanvas().layers():
            
            layerType = mapLayer.type()
            layerName = mapLayer.name()
            intersectionName = "intersection_" + layerName + "_" + tileId

            #vector layers and raster layers are processed differently
            if layerType == QgsMapLayer.VectorLayer and layerName != "tile":
            
                #Calculate the intersection between the specific grid rectangle and the layer
                intersection = processing.runalg("qgis:intersection", mapLayer, tileLayer, None)

                iface.addVectorLayer(intersection.get("OUTPUT"),intersectionName,"ogr")
                
                #create a shapefile for this new intersection layer on the filesystem. 
                #A separate folder will be added for each square
                intersectionLayer = QgsMapLayerRegistry.instance().mapLayersByName(intersectionName)[0]
                QgsVectorFileWriter.writeAsVectorFormat(
                        intersectionLayer, 
                        folder + "\\" + layerName + ".shp", 
                        "utf-8", QgsCoordinateReferenceSystem(4326), 
                        "ESRI Shapefile")

                #remove the intersection layer from the canvas
                QgsMapLayerRegistry.instance().removeMapLayers( [intersectionLayer.id()] )
                    
            elif layerType == QgsMapLayer.RasterLayer:
                
                #Calculate the intersection between the specific grid rectangle and the raster layer
                intersection = processing.runalg('saga:clipgridwithpolygon', mapLayer, tileLayer, None)
                
                #add the intersection to the map
                iface.addRasterLayer(intersection.get("OUTPUT"), intersectionName)

                #export to file
                intersectionLayer = QgsMapLayerRegistry.instance().mapLayersByName(intersectionName)[0]
                
                pipe = QgsRasterPipe()
                provider = intersectionLayer.dataProvider()
                pipe.set(provider.clone())
                
                rasterWriter = QgsRasterFileWriter(folder + "\\" + layerName + ".tif")
                xSize = provider.xSize()
                ySize = provider.ySize()
                
                rasterWriter.writeRaster(pipe, xSize, ySize, provider.extent(), provider.crs())
                
                #remove the intersection layer from the canvas
                QgsMapLayerRegistry.instance().removeMapLayers( [intersectionLayer.id()] )
                
            else:
                print "layer type not supported"
        
        #remove the temporary tile
        QgsMapLayerRegistry.instance().removeMapLayers( [tileLayer.id()] )

Eventually I'll create a proper QGIS plugin for this that allows setting input parameters without all that hardcoded logic.

Tuesday, November 11, 2014

Game-development Log (11. Persistence and Authentication)


Work-in-progress: https://site-win.azurewebsites.net

On this new iteration the units now have owners. A user can only move his own units (represented in blue) and won't be able to change the other player's units (represented in red).

Authentication

I've used the default template that comes with ASP.NET MVC 5. It includes most of the logic to create and manage users, integrate with Facebook/Google/Twitter, including persistence support with Entity Framework.

I did have to tweak it but most was actually pretty simple. Here's the end-result:
  • I've added register/log in buttons at the top.

  • After Log-in/Register the username is displayed, included a dropdown menu with additional options. The "Profile" button opens a new page to link between local and external accounts and to change the password.


The aesthetic still needs tons of work, but at least most of the functionality is there. Currently I only allow local users, Facebook and Google.

Persistence

The unit movement is now persisted on a SQL Server database at Azure, using Entity Framework. To validate it just move an unit and refresh the browser.


Add Units

I've added a "Developer" menu. Currently it allows units to be created on the map.


HTTPS (and CDN)

As I've added authentication to the site I've changed everything from HTTP to HTTPS. Unfortunately, although Azure's CDN supports HTTPS endpoints, it gets much slower than its HTTP counterpart. Also, I was getting random 503 responses.

So, for now, I've removed my usage of Azure's CDN altogether, either pointing to the blob storage for the static image tiles or to the Tile-Service webAPI for the dynamic ones.

I really love Azure, but its CDN really sucks, particularly comparing against the likes of Amazon, Cloudfront, Akamai, Level3, etc.

Sunday, October 26, 2014

Game-development Log (10. Real-time with SignalR)


Work-in-progress: https://site-win.azurewebsites.net/ 

On this iteration I'm adding real-time notifications to the unit movement using the (awesome) SignalR library.

The idea for this will be simple: if a player moves a unit on his browser window all the others players will see that unit move in realtime on their browsers.

I've created an ultra-simple video demoing it. I've opened three separate browser windows: one with Chrome, Firefox and Safari. The movement of the units should be synchronised in real-time across the various browsers, regardless of the one that triggered the movement.


So, how was this setup? Easy as pie.

1. Add SignalR NuGet package
install-package Microsoft.AspNet.SignalR

2. Initialise SignalR on the Startup routine of ASP.NET MVC 5 (on previous versions it's slightly different)
public partial class Startup
{
    public void Configuration(IAppBuilder app)
    {
        app.MapSignalR();
    }
}
3. Create a Hub
My hub will be ultra simple. It will simply receive a movement notification and share it with all the other SignalR clients as is.
public class UnitHub : Hub
{
    public void SetPosition(dynamic unitdata)
    {
        Clients.Others.unitUpdated(unitdata);
    }
}

4. Create Javascript code both to send a SignalR message when the player moves a unit or when a notification of another player moving a unit has been received.
//code to receive notification from server
unitUpdated = function (unit) {
 // (...)
};

// Code to submit to server
server.setPosition(unit);
5. (Optional) If you're using Azure, you should enable WebSockets on your website.
And that's it.

Please note that I haven't yet added persistence nor support for different users. Thus, everyone will be moving the same units. Anyway, I don't have that many page views on my blog for it to be a problem :)

So, what's next?
- Adding a database to persist the units position
- Adding users, each with his own units.
- Authentication with Facebook, Twitter, Google, Windows, Email

Thursday, October 23, 2014

Game-development Log (9. "Bootstraping")


Work-in-progress: https://site-win.azurewebsites.net

This will be a short one. I'm basically picking up my map page and adding a bootstrap template around it.

I'm not tweaking it too much, just adding a couple of navigation buttons, some modals and some cosmetic details (like a subtle transparency on the navigation bar).

Without Bootstrap:


With Bootstrap:

Some buttons on the navbar already open some modals but it's mostly a placeholder for the functionality, like the Sign in one.


Also, Boostrap provides, out-of-the-box, responsive design. Thus the mobile-like display looks like:


So, nothing too fancy but I really love the "cleaness" that Bootstrap provides. I still need to tweak the UI a little bit but I'm not expecting it to change that much.

Sunday, October 19, 2014

Game-development Log (8. Performance Checkpoint - I)


Work-in-progress: https://site-win.azurewebsites.net

I don't want to have my full architecture set up only to realise that something isn't really scalable or performs sub-par. Thus, time for a performance checkpoint where I'm reviewing some of my bottlenecks and try to fix them.

Zoomed-out tile images

Currently my image tiles are generated dynamically per request and stored on the Azure CDN. Although this is quite interesting from a storage point-of-view/setup time it has a drawback: the time it takes to generate an image on the furthest away zoom levels, particularly for the unlucky users that get cache misses on the CDN.

The reason is quite-simple: a tile at zoom level 7 includes about 16.000 individual hexagons, requiring some time (like a couple of seconds) to render. For comparison, a tile at zoom level 12 includes about 30 hexagons and is blazing fast to render.


Pre-generating everything is not an option so I opted for an hybrid-approach:
  • Between zoom levels 7 and 10 (configurable) I generate the tile images and store them on Azure's blob storage with a CDN fetching from it.
  • After 11+ they're generated dynamically and stored on the CDN (as they were)
So in practice I now have two different urls on my map:
So the question is: how many tiles will I need to pre-generate?

The math is quite straight-forward:

tiles for zoom level n = 4^n

tiles 7 = 4^7 = 16.384
tiles 8 = 4^8 = 65.536
tiles 9 = 4^9 = 262.144
tiles 10 = 4^10 = 1.048.576

total = 1.392.640

As I only generate tiles with data, and considering that 2/3 of the planet is water, the approximate number of hexagons generated would be:

approximate number = total * 0.33 ~ 460.000 images

Not too bad and completely viable, particularly as I don't expect to be re-generating these images very often.

Vector-Load to support unit movement

Something that I was noticing is that panning the map view on higher zoom levels was a little bit sluggish, particularly as it was loading the vector tiles with the hexagon data in order to calculate the movement options of the units.

I was loading this info per-tile during panning, which was blocking the UI thread. A colleague of mine suggested me to try something else: HTML5 Web Workers. You basically spawn a worker thread that is able to do some work (albeit with some limitations, like not being able to access the DOM) and using messaging to communicate with the main UI thread.

The implementation was really straightforward. Unfortunately I didn't really notice any performance improvement. Anyway, Web Workers could be an incredibly viable alternative if I ever switch to a client-based drawing logic instead of completely server-side. I've added an entry to my backlog for some WebGL experiments with this :)

I then had a different idea: instead of loading the hexagon-data tile by tile make a single request that would include the various tiles that compose the current viewport. This is triggered on the "viewchangeend" Bing Maps event, particularly using a throttled event handler.

There was a small performance benefit on this approach and it can be further optimised, particularly leveraging local-storage on the client.

Change from PNG to JPEG

At a certain point in time my tiles required transparencies but that's no longer the case. Thus, and although being hit with a small quality downgrade, I've changed my image tiles from PNG to JPEG.

This has 3 advantages:

  • Storing the images on the CDN/Blob Storage will be cheaper as the JPEG images are considerably smaller
  • Latency on loading the image tiles
  • A more subtle advantage happens on the rendering process, as JPEG is faster to load and process, especially when the PNG counterpart has an alpha-channel.

The drawback is, as mentioned, image-quality. Here's a PNG image tile and the corresponding JPEG.


Highly compressed and noticeable image-loss but on the map as a whole is mostly negligible, particularly if there's no reference to compare. I'm more worried with performance than top-notch image quality.

Saturday, September 27, 2014

Game-development Log (7. Attack and explosions)


Work-in-progress: https://site-win.azurewebsites.net

On my last post I've added interactivity to the units. On this post I'm taking it further by adding an attack option and corresponding explosions :)

First of all I've included an extra tank on the map that's not controllable by the player. Hence, a nice target to be attacked (although non-destructible).

The attack is triggered in the same way as a regular movement, by dragging the unit. When on-top of another unit it changes to an attack cursor, showing additional info.


I've implemented the explosion using the particle lib at http://scurker.com/projects/particles/


To place the explosion on Bing Maps I've used the pushpin's "htmlContent" property to create a new canvas where the explosion is rendered.

I've also used a custom html pushpin to display the attack details. For now only the range isn't hardcoded.

And that's it for now.


Wednesday, September 24, 2014

Saturday, September 13, 2014

Game-development Log (5. CDN Caching for map tiles)


Work-in-progress: https://site-win.azurewebsites.net

The map that was displayed on my previous post was using an Azure Web-Site to render the tiles. On this iteration I've included a CDN so that the tiles are cached and the latency is minimal when serving them.

Generically speaking this is my target architecture including a CDN:


  1. The map displayed on the browser requests a tile to the CDN
  2. The CDN checks if it contains the image or not
  3. If not, it queries the tile-server for that particular image
  4. The Tile Server generates it as described on my previous post
  5. The CDN stores the image tile 
  6. The CDN returns the image to the browser

Saturday, August 9, 2014

Game-development Log (2. Visual Studio Online)


Work-in-progress: https://site-win.azurewebsites.net

IMHO a project needs planning/tracking. I'm all pro-Agile, but using that as an excuse to avoid any analysis, documentation and tracking is a common mistake. Also, it's very hard to deliver working software without a proper release cycle. With that said, one could argue that for a single-person project this isn't by any means a requirement. Regardless, I plan to do it and I'll try to follow a professional approach to building this game (which sometimes isn't particularly easy as I'm doing it on my free time after both my kids have gone to bed :D).

I'm using Visual Studio Online for work-items/release management and source-control, including its link to Azure.

Friday, August 8, 2014

Game-development Log (1. Introduction + WebAPI for map tiles)


Work-in-progress: https://site-win.azurewebsites.net

Although my blog has been mostly dormant for the last few months I've kept myself busy making various experiments with mapping and gaming. I've expanded some of the ideas that I've already posted and I've prototyped some new stuff.

My intent: to create a massive online strategy game where there's a single shared persistent battleground and a pseudo-realtime gameplay mechanic. Yeah, lots of fancy words without saying much, but if it all goes as planned could be quite interesting. In a worst case scenario should be fun to build.

My plan is to document the progress on my blog (particularly as what I have now are mostly disconnected pieces) and deploy the new iterations as frequently as possible.

Wednesday, April 2, 2014

Generating Server-side tile maps with Node.js (Part 2 - Using Mapnik)

Part 1 - Programatically with Canvas
Part 2 - Using Mapnik

On my previous post I've shown how to use node.js to generate server-tiles, painting them "manually" using the canvas API. This is perfect for those scenarios where one wants to overlay dynamic or custom data on top of an existing map. The following images (although done on client-side with canvas) are good examples of this:


Now, suppose we don't want to generate data on top of a map but the map itself. Meaning, a tile more or less similar to this:
This is very complex as it requires loading spatial data, painting the countries, roads, rivers, labels, always taking into account the zoom level, etc. Not trivial at all.

Thursday, January 23, 2014

Generating server-side tile-maps with Node.JS (Part 1 - Programatically with Canvas)

Part 1 - Programatically with Canvas
Part 2 - Using Mapnik

This will be a series of posts on leveraging Node.js to generate tile-images on server-side that will be displayed on top of Bing Maps (although applicable to any other mapping API).

For those not familiar with it, Node has gained lots of momentum on the web. It provides a simple event oriented, non-blocking architecture on which one can develop fast and scalable applications using Javascript.

It lends itself really well for generating tile-images and is in-fact being used by some large players like Mapbox.

On this first post I'm going to generate very simple tiles. I won't fetch data from the database nor do anything too fancy. Each tile will simply consist on a 256x256 png with a border and a label identifying the tile's z/x/y. Conceptually something like this:


I'm going to use an amazing Node module called Canvas which provides the whole HTML5 Canvas API on server-side. My main reason is that it's an API that I know particularly well and I can reuse lots of my existing code.

I'm going to develop on Mac OS X but most of this would be exactly the same on Windows or Linux.

Afterwards, as an extra, I'm also going to provide instructions on how to setup a Linux Virtual Machine in Azure running the resulting node application.