Part 1 - MapCruncher
Part 2 - TileMill
Part 3 - TileStache
Part 4 - Programmatically
Part 5 - Offline maps on iOS
Part 2 - TileMill
Part 3 - TileStache
Part 4 - Programmatically
Part 5 - Offline maps on iOS
When drawing overlays on top of a map one can choose between two different methods: custom map tiles or using the map API.
On this series of posts I'm going to show what are custom map tiles, how overlaying them compares to using the map API in client-side and finally how to interact with the tiles.
The most usual way to draw something on top of a map is by using the map API. Drawing points, icons, lines, polygons is something that most (all?) map providers support, and is typically straightforward. Using the map API has many advantages regarding client-interaction. For example, one may get mouse over events, click-detection, manipulate the geometry in real-time, change colors, etc real easily.
Let's create a very simple example of this: we'll place a box on top of a map which will change color when the cursor is placed on top of it and displays an alert when clicked upon.
The end result should be something like this (using Bing Maps V7):
 |
| Mouse over |
 |
| Mouse out |
 |
| Mouse clicked |
Now, regarding custom map tiles, let me first explain what they are. If you're already familiar with this topic you may safely jump ahead. Anyway I've already included a basic explanation of this in one of my previous topics.
[Explanation Start]
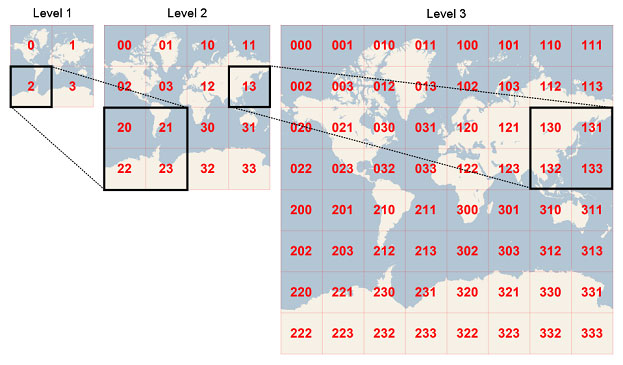
At the first zoom level we split our map into 4 tiles. Each time we zoom in the same geographic area that was contained in 1 tile becomes 4 tiles. At zoom level 20 you have 4^20 = 1.099.511.627.776 tiles. The number of visible tiles depends on the size of the html map as the tiles are of fixed size.
[Explanation End]
Now, let's create the tiles. The easiest way is, by far, to use a Microsoft Research tool called MapCruncher. It's pretty unaltered since 2007 but still works just fine. Grab it here.
Using the tool is pretty straightforward. When loaded the screen is split in two halfs .One with a map and the other with a square saying: "To get started, select File | Add Source Map". As instructed by the app, go to File > Add Source Map and select the downloaded image. It will appear on the left side portion of the screen.
The idea is to add corresponding points on each image. Just zoom and pan each map so that the map centers match specific points on each map. Then press "Add".
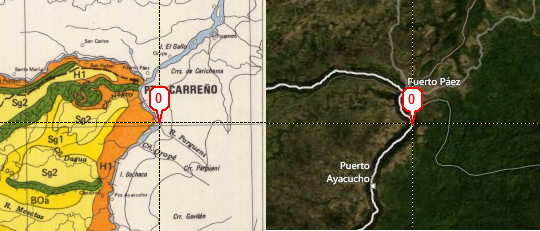
Repeat this step as necessary until you have some matches. I've added 7 matching points but you could have used less. To preview the results press "Lock". Both maps will move at the same time, and you can check if the mapping is working as desired.
Also, if you look closely, when locked you'll see that the left image has its horizontal edges bended. That's because the images are using different map projections and MapCruncher warps the image so that the key points match. Otherwise one would never be able to use images with a projection other than Mercator.
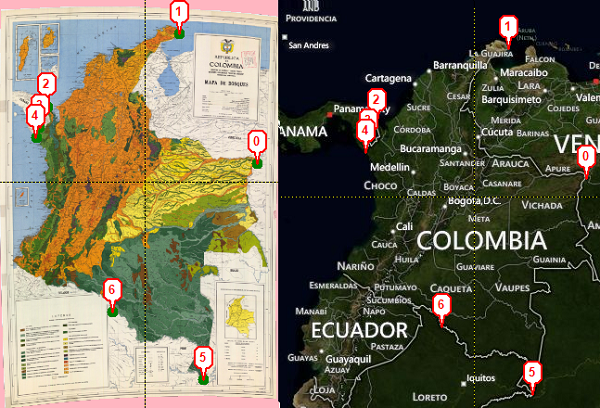
You can use less points or more points, your call. More points usually give better results.
Now press Render. It should take a while, so go grab a cup of coffee or something. Actually, you have to time to lunch and probably take a stroll before this process completes...
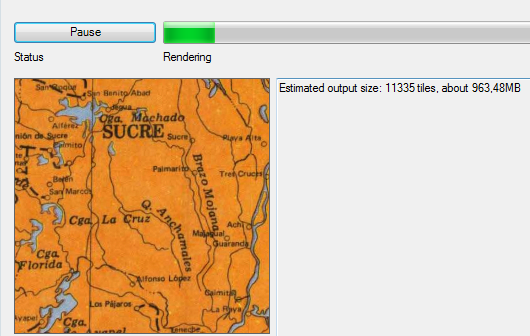
90 minutes later:
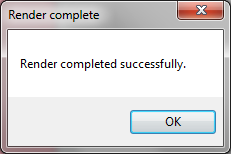
FINALLY!!!
I guess I could have chosen a smaller image for the purpose of this post... Anyway, it's done, so let's try it.
I'll create a basic map with a checkbox to toggle the visibility of the custom tile layer.
The end result should be like this:
The source-code for this example is:
As usual, I've included a video showing this web page in action:
Now, what's the problem with tiles? Interactivity!
Imagine the first example of this post, the one with the map API? How could we achieve the same using custom-tiles? They are just images in client-side so, to detect if we were clicking inside the rectangle we would have to ask the server (the one with the "real" information). Also, and even assuming that the click would work (with a small delay thus), how could the onmouseover color change happen? Not likely right?
Well, that will be the topic for my next post, and I can promise you that it will be freaking cool :D
Imagine an image of a world map. Now suppose that we cut that image into small squares called tiles; each map-tile is an image with 256x256 pixels. Now check the following diagram that I borrowed from Microsoft.

At the first zoom level we split our map into 4 tiles. Each time we zoom in the same geographic area that was contained in 1 tile becomes 4 tiles. At zoom level 20 you have 4^20 = 1.099.511.627.776 tiles. The number of visible tiles depends on the size of the html map as the tiles are of fixed size.
This technique is used by Google Maps, Bing Maps, Leaflet, and most of the others. The only thing that may differ is the way the map client asks for a specific tile, and although each provider has it's own specification they're similar enough.
If you want do delve into some details check Bing Maps Tile System. This logic is the same for Google Maps, OpenStreetMap, etc.
We may also put our own tiles on top of the base map. They're typically
precalculated and stored as images on the server filesystem/cloud, but may as well be
calculated on the fly or use an hybrid approach (precalculated but
stored in the database for example). Remember that the output is always the same though: a 256x256 image.
[Explanation End]
Custom map-tiles have the advantage of being fast to render regardless the number of points/polygons being drawn as they're plain images which are overlaid on top of the map. For example, imagine that we have really complex polygons to draw with thousands of points. Drawing them using the map API would make the map sluggish and unusable but if they were already rendered as image tiles there would no performance hit when moving around the map. Another example: imagine that you have some photographs that you want to overlay on top of the map. You just can't to that without tiles (server-generated or client-generated).
So, without further ado, I'll create a map with a tile overlay of an image that we'll get from the web.
First, let's search for an interesting map to overlay. I've searched for "Crime map Europe" with "Larger than 70 MP" option. The first result is curiously a map of... Colombia. Not exactly what I was looking for but will do. You can grab the image here, or use some other if you like. Ideally should be a large image so that you have closer zoom level tiles.
Now, let's create the tiles. The easiest way is, by far, to use a Microsoft Research tool called MapCruncher. It's pretty unaltered since 2007 but still works just fine. Grab it here.
Using the tool is pretty straightforward. When loaded the screen is split in two halfs .One with a map and the other with a square saying: "To get started, select File | Add Source Map". As instructed by the app, go to File > Add Source Map and select the downloaded image. It will appear on the left side portion of the screen.
The idea is to add corresponding points on each image. Just zoom and pan each map so that the map centers match specific points on each map. Then press "Add".

Repeat this step as necessary until you have some matches. I've added 7 matching points but you could have used less. To preview the results press "Lock". Both maps will move at the same time, and you can check if the mapping is working as desired.
Also, if you look closely, when locked you'll see that the left image has its horizontal edges bended. That's because the images are using different map projections and MapCruncher warps the image so that the key points match. Otherwise one would never be able to use images with a projection other than Mercator.

You can use less points or more points, your call. More points usually give better results.
Now press Render. It should take a while, so go grab a cup of coffee or something. Actually, you have to time to lunch and probably take a stroll before this process completes...

90 minutes later:

FINALLY!!!
I guess I could have chosen a smaller image for the purpose of this post... Anyway, it's done, so let's try it.
I'll create a basic map with a checkbox to toggle the visibility of the custom tile layer.
The end result should be like this:
 |
| Without layer |
 |
| With layer |
The source-code for this example is:
<html>
    <head>
        <meta http-equiv="Content-Type" content="text/html; charset=utf-8"/>
        <title>Bing Maps - using Custom Tiles</title>
        <style type="text/css">

            .map
            {
               width: 640px;
               height: 450px;
               position:relative;
            }
        </style>

        <script type="text/javascript" src="jquery-1.4.2.js"></script>
        <script type="text/javascript">

            var MM;
            var map;
            var bingMapsURL =
                'http://ecn.dev.virtualearth.net/mapcontrol/mapcontrol.ashx?v=7.0';

            $(function () {

                $.ajax({
                    url: bingMapsURL,
                    dataType: 'jsonp',
                    jsonp: 'onscriptload',
                    success: function (data) {

                        MM = Microsoft.Maps;

                        map = new MM.Map($('#mapDiv')[0], {
                            credentials: "BING MAPS KEY GOES HERE",
                            showCopyright: false,
                            showDashboard: false,
                            mapTypeId: MM.MapTypeId.road,
                            showLogo: false,
                            showMapTypeSelector: false,
                            showScalebar: false,
                            center: new MM.Location(5, -74),
                            zoom: 5
                        });

                        var tileSource = new Microsoft.Maps.TileSource({
                            uriConstructor:
                                'http://localhost/spatial/tiles/{quadkey}.png'
                        });

                        var tilelayer = new Microsoft.Maps.TileLayer({
                            mercator: tileSource,
                            opacity: 1.0,
                            visible: false,
                            zIndex: 1
                        });

                        map.entities.push(tilelayer);

                        $("#checkToggle").change(function () {

                            var layer = map.entities.get(0);

                            if ($(this).is(':checked')) {
                                layer.setOptions({ visible: true });
                            } else {
                                layer.setOptions({ visible: false });
                            }
                        });
                    }
                });
            });
        </script>
    </head>
    <body>

        Show Layer: <input id="checkToggle" type="checkbox"/>
        <div id="mapDiv" class="map"/>
    </body>
</html>
As usual, I've included a video showing this web page in action:
Now, what's the problem with tiles? Interactivity!
Imagine the first example of this post, the one with the map API? How could we achieve the same using custom-tiles? They are just images in client-side so, to detect if we were clicking inside the rectangle we would have to ask the server (the one with the "real" information). Also, and even assuming that the click would work (with a small delay thus), how could the onmouseover color change happen? Not likely right?
Well, that will be the topic for my next post, and I can promise you that it will be freaking cool :D
Go to Part 2


What an awesome and very nice post. I just stumbled upon your weblog and wanted to say that I’ve really enjoyed browsing your blog posts.
ReplyDeleteIn any case I will be subscribing to your rss feed and I hope you write again very soon!
click here