
In my previous post I've created an hexagon layer in client-side using HTML5 Canvas. In this post I'm going to generate the hexagons on the server and display them on a map. So, the roadmap for this post will be:
- Generate the hexagons in C#
- Store them as spatial data in SQL Server 2008 using NHibernate Spatial
- Use QuantumGIS (or any other GIS tool for that mater) to read that data and tweak it
- Use Tilemill to generate a layer of .mbtiles, including UTFGrid data of the hexagons
- Extract the .mbtiles file to image files
- Use the data on a Leaflet map.
- Create some basic interaction on the map
If you want you can skip to the end result.
Now, we've got two options for this. We can create hexagons that overlay perfectly on top of the map, all of them having the same pixel size, or all have the same edge size in meters, regardless of where they are on the world.
This is a particularly interesting decision because it will have a great deal of impact on how the hexagons are displayed. Why? Because, as with any planar projection, some distortion occurs. Google/Bing/Leaflet use a projection popularly called as "Web Mercator", and a world map looks like this (taken from OpenStreetMaps):
 |
But, if we want edges with real-distance parity, the hexagons will be displayed distorted on the map. So, decisions, decisions, we've got to choose. So, to summon up, we can:
- Have a geographical correct hexagon which has all sides with the same geographic distance (in meters) that looks distorted on the map.
- Have a geographical incorrect hexagon that looks nice on Web Mercator maps.
I'm a hands-on person, so I've implemented both. Then I'll choose one of the approaches and stick with it for the remainder of the post.
Implementation 1 - geographical correct, distorted on the map
The algorithm will be pretty simple. Start with a coordinate and then, knowing the bearing (angle from the North - counter-clockwise) and the distance (edge size in meters) determine the target point. Do this for all the points of the hexagon. Repeat the process for each hexagon.
The bearing is easy to find. Knowing that, in a regular hexagon, the inside angles are all 120º, I've drawn this piece of art.

The displayed angles correspond to the bearing. I've included a solution with all the source code where you might check the algorithm.
After running the program we've got a bunch of hexagons in the database, stored in a geography column. SQL Server Management studio allows us to show the data according to several projections, one of them being Mercator.

So, choosing Mercator, this is what we get:

This is what would appear on top of the Leaflet map. It's kind-of interesting, and from a gameplay point-of-view is more fair to the players because the hexagons have the same geographic area (as opposed to pixel area). Looks a little bit strange though.
Let's check the other alternative.
Implementation 2 - geographical incorrect, aligned on the map
I'm not going to bother you with all the details, but the algorithm will basically work with on a planar web mercator projection in pixels to create the hexagons, and convert each point to the corresponding geographic coordinates. I've used the algorithms explained here to go from pixel coordinates to lat/lon.
After running the program and choosing the Mercator projection, our query in SQL Management Studio shows this:

Pretty nice. Every hexagon of the same pixel size and all lined-up.
Now, although the first option was more groovy, I think I'll opt for this one to display on the map.
So, and for the remainder of this post, you may safely forget the first option.
Now that we have some data to work with we'll enrich it a little bit. I just want the hexagons that are placed on top of Europe so I'm going to cook it with a shapefile of the world-countries. A simple "shapefile world" search on Google brought me to this url,where I've download the file named: TM_WORLD_BORDERS-0.3.zip.
There are several ways to get the data out of SQL Server. I recommend using Quantum GIS (QGIS). It's free, powerful, what's not to like?
The problem is that the current stable version doesn't support SQL Server 2008 natively. I've downloaded the latest one (1.9.90-Alpha) using the OSGeo4W distribution which brings SQL Server native support.
Anyway, after firing up QGIS let's add the downloaded worldmap shapefile.

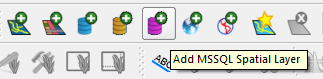
Afterwards, use the new "Add MSSQL Spatial Layer" button.
Select the table/column to import and add the result to the current project.

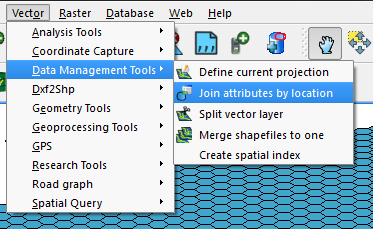
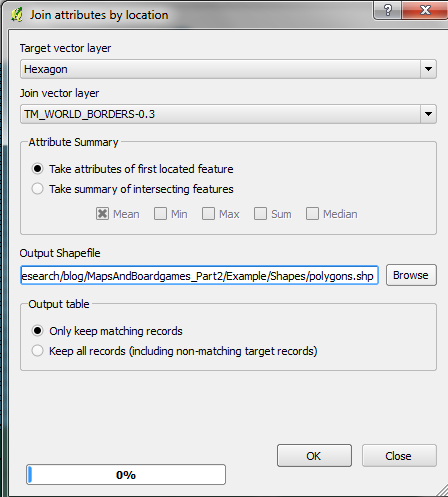
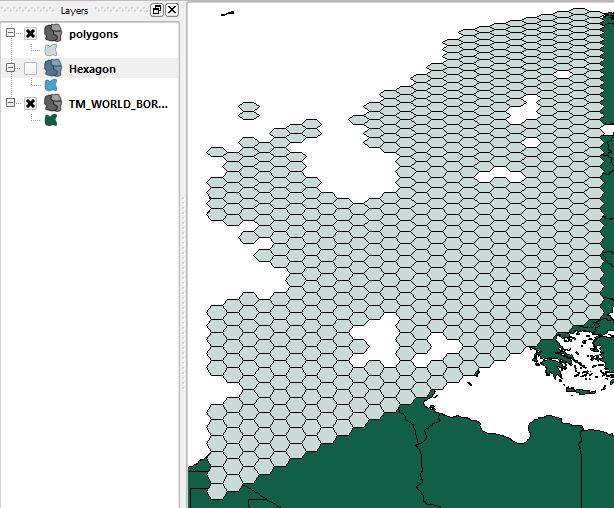
Now, let's do something cool. Let's merge the attributes of the world map that we downloaded to the hexagons and clip the hexagons that don't match with any country terrain, i,e, water .
Name the new file "intersection.shp".
When asked accept to add the layer to the TOC.
Hide the hexagon layer.
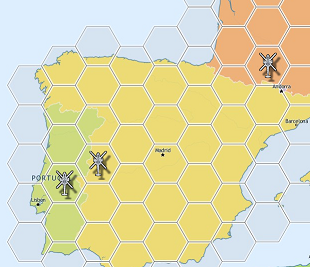
The displayed result should be something like this:
Now, using TileMill I'm going to create the base tiles. I'll copy the base map of one of TileMill example projects: "Geography Class". Also, add some cosmetic effect on the hexagons.
The end result should be this (still inside TileMill).

I've created a version with and another without the hexagons.
Now, let's export the mbtiles. If necessary follow the instructions in one of my previous posts.
I've created the following page:

Drag the helicopters from hex to hex and it will snap to its center.
You can try the demo page here
Go to Part 3
(in Portugues)
ReplyDeleteOlá,
Estou com problemas de encontrar um banco dessas imagens de fundo como no demo.
Você tem como me fornecer isso? O banco de dados de Imagens PNG.
Ou como eu monto o meu banco de imagens?
Agradeço
Pedro'S Tech Mumblings: Maps And Boardgames (Part 2 - Using Server Tiles) >>>>> Download Now
Delete>>>>> Download Full
Pedro'S Tech Mumblings: Maps And Boardgames (Part 2 - Using Server Tiles) >>>>> Download LINK
>>>>> Download Now
Pedro'S Tech Mumblings: Maps And Boardgames (Part 2 - Using Server Tiles) >>>>> Download Full
>>>>> Download LINK gv
Olá,
ReplyDeleteO TileMill é utilizado exactamente para isso, para criar imagens com base em informação vectorial. Se calhar no meu post anterior desta série é mais fácil de perceber o fluxo.
Mas você quer gerar imagens suas ou só quer imagens existentes para servir de fundo? É que há tiles disponíveis online, como no OpenStreetMap ou CloudMade (também baseados no OpenStreetMap).
Estes meus tiles em particular não lhe devem ser muito úteis, dado que incluem estes hexágonos e só os gerei para a zona da Europa sem todos os níveis de zoom.
Pedro,
DeletePrimeiro obrigado pela atenção, segundo seu blog é fabuloso.
Sobre as imagens preciso delas offline, posso criar as minhas aqui, ou baixar, só preciso pra fundo mesmo, sem nada de muitos detalhes. Eu consigo fazer no TileMill? Tem algum tutorial?
Agora se eu conseguir baixar elas em PNG, me indica um site pra isso, não encontreu no OpenStreetMap
Tenho um blog post exactamente com esses passos, utilizando o Tilemil: http://build-failed.blogspot.pt/2012/03/custom-map-tiles-part-2-tilemill.html
DeletePedro'S Tech Mumblings: Maps And Boardgames (Part 2 - Using Server Tiles) >>>>> Download Now
ReplyDelete>>>>> Download Full
Pedro'S Tech Mumblings: Maps And Boardgames (Part 2 - Using Server Tiles) >>>>> Download LINK
>>>>> Download Now
Pedro'S Tech Mumblings: Maps And Boardgames (Part 2 - Using Server Tiles) >>>>> Download Full
>>>>> Download LINK Dt