
Part 1 - MapCruncher
Part 2 - TileMill
Part 3 - TileStache
Part 4 - Programmatically
Part 5 - Offline maps on iOS
Part 2 - TileMill
Part 3 - TileStache
Part 4 - Programmatically
Part 5 - Offline maps on iOS
In my previous post I've shown a really simple way of overlaying custom map tiles on top of Bing Maps using MapCruncher.
One of the problems with that approach is that it only works for raster files. If one needs to do more complex stuff like creating tiles with data from shapefiles, kml or databases then a different method/tool must be used.
We have three challenges here:
- How do we create a raster map representation of our raw data?
- How do we split that image in tiles?
- How do we serve those tiles to the map client (like Bing/Google maps)?
This post will be a little big. I want to build a complete example by gradually adding complexity to it. So, this is the roadmap:
Intro
- Create a simple map with the portuguese freguesias (similar to administrative parish)
- Split the map image in tiles
- Display them on a map with Leaflet
A better looking map
- Enhance the cosmetic of the map a little bit with labels and conditional styles
Add interactity
- Use the UTFGrid technology and Wax to provide client-side interaction with the map to show a tooltip on the freguesias.
There's much ground to cover so let's get started.
Note: Most of the free GIS tools are better suited for Linux/MacOSX. I'm mostly a Windows developer so all my examples will be done on a Windows 7 machine, unless stated otherwise.
Prerequisites
- Install TileMill
- (optional) Install a GIS system or some other tool that allows for the re-projection of coordinates. I recommend Quantum GIS (it's free and powerful, what's not to like?).
Intro
Create a simple map with the portuguese freguesias.
- Get the shapefile from here.
- Extract all the files to some folder.
- My data is in a specific projection that is only used in Portugal. So, and although TileMill can autodetect other projections from the "prj" file, it fails to do so for this data. I'll use Quantum GIS to reproject this data to WGS84. This is a little bit out-of-the scope of this post, but these are the steps to do it using Quantum GIS:
- Layer | Add Vector Layer
- Vector | Data Management Tools | Export to new projection | Choose WGS84
- Open TileMill
- Use the "New project" button to create a new project

- Choose the project name. In my case it will be called "Freguesias".

- Because we've kept the "Default data" checkbox active, the default map already includes a styled map with a simplistic country view.

- Press "Add Layer" and choose the reprojected shapefile and the WGS84 projection.

- Our map should appear on top of the base map, already styled with some defaults.

- We'll zoom in and out a little bit just to check things out. The default seems OK so let's export the map using the top-right button called "Export".
- We have several export options. Unfortunately there isn't an "export to folder" that stores all the tile-images in separate files. Fortunately it provides something that could become the standard in the near-future: MBTiles. This format is basically a SQLite file with all the tile images stored in it (with some extras). Let's use this.
- Also, limit the rendering bounds and zoom levels. This will have a huge impact on the total number of tiles. In my case I've placed the bounds over the Iberian Peninsula and limited the zoom levels between 6 and 14.

- Press "Export". This could take a lot of time. In my computer it took about 1 hour but could be much less or much more, depending on the amount of data, the complexity of shapes, etc.
- After exporting we have a freguesias.mbtiles file in the disk, probably in \My Documents folder. Now we could do two things:
- Use a Tile-server with the mbtiles file as a data-source
- Convert the mbtiles file to separate image files in the filesystem.
- I'll opt for the second option as it's less restrictive. So, how to we do it? I have good news and bad news. The good news is that the same folks that developed the MBTiles spec have created a free tool that converts to/from mbtiles: MBUtil. The bad news is that it only works in Linux and, although I also have an Ubuntu machine, I would prefer to keep everything in Windows. But this isn't a big issue as we can use Cygwin to run it. Cygwin is not a way to run Linux inside Windows but pretty much behaves as Linux allowing us to compile and run Linux apps there.
- So, let's install Cygwin. You can download it from here.
- When installing you should pick the following packages, as they're required by MBUtil (and pretty much by everything else GIS related)
- Git
- Python
- SQLite3
- Now, we'll do as instructed in the MBUtil page
git clone git://github.com/mapbox/mbutil.git
cd mbutil
python setup.py install
- Now, copy the .mbtiles file to cygwin. Assuming that you installed "cygwin" at it's default directory the user home is mapped to c:\cygwin\home\<user>
- Run the following command:
mb-util --scheme=osm Freguesias.mbtiles FreguesiasNow, let's use these tiles in Leaflet. I'll assume that you've placed them in IIS inside a virtual directory called "tiles" and a subdirectory falled "freguesias".
var tilesUrl = 'http://localhost/tiles/freguesias/1.0.0/FreguesiasPT/{z}/{x}/{y}.png',
tilesLayer = new L.TileLayer(tilesUrl);

map = new L.Map('map');
map.addLayer(tilesLayer);
map.setView(new L.LatLng(39.5,-5.0), 6);
The map appears in Leaflet. We can zoom in to see the polygons in a little bit more detail.
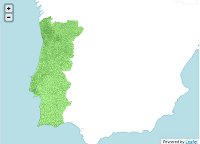


Not that interesting but works. Let's make it a little bit more pretty and useful.
A better looking map
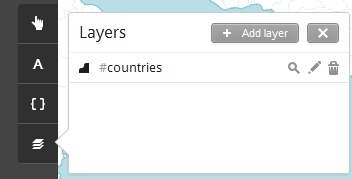
- Inside TileMill let's look at the map style on the "style.mss" file.
- The default style after importing our layer is
Map {
  background-color: #b8dee6;
}

#countries {
  ::outline {
    line-color: #85c5d3;
    line-width: 2;
    line-join: round;
  }
  polygon-fill: #fff;
}

#freguesias {
  line-color:#594;
  line-width:0.5;
  polygon-opacity:1;
  polygon-fill:#ae8;
}

This CSS-like language is called "Carto". It's pretty easy to use, and it borrows some ideas from CSS3.
You can see Carto reference inside TileMill by using the button that looks like some brackets.
Now let's get started:
I want to:
- only show contours when at a zoom level above 8
- according to the area of each freguesia paint the background with a different color
- some other small tweaks
The complete style will be:
Map {
  background-color: #b8dee6;
}

#countries {
  ::outline {
    line-color: #85c5d3;
    line-width: 2;
    line-join: round;
  }
  polygon-fill: #fff;
}

#freguesias {
  line-color:#190701;
  line-width:0;
  polygon-opacity:1;

  [AREA_EA_HA > 0] {
    polygon-fill:#fcd1d1;
  }

  [AREA_EA_HA > 1000] {
    polygon-fill:#eb9090;
  }

  [AREA_EA_HA > 2000] {
    polygon-fill:#e05151;
  }

  [AREA_EA_HA > 3000] {
    polygon-fill:#a82b2b;
  }

  [AREA_EA_HA > 5000] {
    polygon-fill:#7a1e1e;
  }

  [zoom > 8]{
    line-width:1;
  }
}
The conditions are placed as [ condition ]. Note that "zoom" is a built-in keyword and "AREA_EA_HA" is a feature from my shapefile. What I did was just the tip of the iceberg.I've also added the following legend:
Hectars: <br/>
<span style='color:#fcd1d1'>▉</span>1000 or less<br />
<span style='color:#eb9090'>▉</span>1001 to 2000<br />
<span style='color:#e05151'>▉</span>2001 to 3000<br />
<span style='color:#a82b2b'>▉</span>3001 to 5000<br />
<span style='color:#7a1e1e'>▉</span>5001 or more<br />
TileMill shows the results immediately in the map window. Our map looks currently like this:

Much more interesting, and actually pretty useful, as we can see a pattern on the size of the freguesias regarding the Portuguese geography. In the south they're typically much larger than in the north.
We're just missing the final touch:
Add Interactivity
Now, under the "Teaser" tab we'll place some HTML to show our freguesia name when the mouse is over the polygon. TileMill uses something called a UTFGrid which basically consists on having an ASCII representation of each tile where each feature has its not ASCII character mapped to a certain content. Then, in client-side, we can easily detect with feature is being clicked or hovered, and show the corresponding information. If this isn't very clear please check the homepage of the spec.
Basically we're mixing some of the advantages of client-side rendering and server-side tiles generation.
How do we do this in TileMill? Basically in the "Teaser" tab we place the following text:
{{DICOFRE}}
This is the code of our "Freguesia", which is a data attribute of the features inside the shapefile. In javascript we'll use Wax. It simplifies handling the UTFGrid data and some other stuff. It's also made by the same folks, so it all fits nicely.
The following code will be used:
var tilejson = {
    tilejson: '1.0.0',
    tiles: ['http://localhost/tiles/freguesias/1.0.0/Freguesias/{z}/{x}/{y}.png'],
    grids: ['http://localhost/tiles/freguesias/1.0.0/Freguesias/{z}/{x}/{y}.grid.json'],
    formatter: function (options, data) { return "CODE: " + data.DICOFRE }
};

map = new L.Map('map');
map.addLayer(new wax.leaf.connector(tilejson));
map.setView(new L.LatLng(39.5,-5.0), 6);

wax.leaf.interaction(map, tilejson);
As you can see the code is now a little bit different. The nice thing is that Wax handles most of the fuss, including a tooltip when the mouse is over a polygon.I've uploaded a very simple video showing this:
Go to Part 3
Nice tutorial, thanks!
ReplyDeleteI've been hacking mapquest xml style for my purposes, but TileMill seems to be much more effective.
Two questions:
- Do you know if all of the recent features in mapnik are available using Carto language?
- Besides "OSM Bright", is there any other mature styles available?
Thanks.
Regarding Carto, it includes the Mapnik 2.0 features. Not particularly sure if anything is missing but, if so, shouldn't be too significant. Anyway, Carto is so nice that I believe it will eventually reach perfect parity with the XML styling feature-set.
ReplyDeleteRegarding provided styles, MapBox also includes a "MapBox Streets" for OpenStreetMaps. Haven't used it yet, but looks really nice.
Really happy to find this, for some time following MapBox good to find posts about it from my country.
ReplyDeleteThanks and keep up the nice articles on GIS stuff,
Jorge Vidinha
Thanks for visiting Jorge ;)
ReplyDeleteAbraço
Pedro
Hello,
ReplyDeletethanks for the great tutorial..
but when i load the .png tiles using leaflet as you show like this:
var tilesUrl = 'http://localhost/tiles/freguesias/1.0.0/FreguesiasPT/{z}/{x}/{y}.png',
tilesLayer = new L.TileLayer(tilesUrl);
map = new L.Map('map');
map.addLayer(tilesLayer);
map.setView(new L.LatLng(39.5,-5.0), 6);
it give me blank page in browser..
what's wrong?
thanks for your help, and sorry for my bad english..
Well, could be a lot of things. First of all, are the tiles already generated and in place?
ReplyDeleteYou can try this easily by opening a browser to the URL that you placed on the "tileURL" variable. Something like:
http://localhost/tiles/freguesias/1.0.0/FreguesiasPT/0/0/0.png
Don't forget to create the virtual directory on IIS.
If this step succeeds and you have a working url, should be a Javascript error. Open Firebug or press F12 in IE/Chrome to see if there are any script errors. If so, and you can't understand them, place a reply here and I'll help you.
i have check the directory, the tile, and all works fine..
Deletewhen i open this:
http://localhost/mapping_project/project_arab/6/35/35.png,
i see one piece of my map..
here's my full code:
--start of html document--
--head tag--
-script src='../src/leaflet.js' type='text/javascript'> -/script-
-script src='../src/wax.leaf.js' type='text/javascript'>-/script-
-link href='../src/leaflet.css' rel='stylesheet' type='text/css' />
--end of head--
--body tag--
--script tag--
var tilesUrl = 'http://localhost/mapping_project/project_arab/{z}/{x}/{y}.png',
tilesLayer = new L.TileLayer(tilesUrl);
map = new L.Map('map');
map.addLayer(tilesLayer);
map.setView(new L.LatLng(21.4,39.8), 6);
--end of script--
--end of body--
--end of html document--
it gives me blank page when it load.
what's wrong with my code?
I don't see anything wrong with your code. Don't you have any Javascript error? Also, my example was using Leaflet 0.3.
ReplyDeleteAnyway, here's an online working sample that I did using Leaflet and TileMill generated tiles. See if it can help you out.
http://psousa.net/demos/maps-and-boardgames-part-2/demo3.html
My javascript is working, nothing error in here..
DeleteOkay..
thx a lot for your help..
i will try it first.. :)
Good evening pedro,,
ReplyDeletethx for your live demo above,but it still not works for me.. :(
i found an error like this when i press F12 in chrome:
- when the map loads, it loads png -> file:///C:/Users/Febrizio/Documents/Mapping_Project/Project/bismillah/6/38/27.png
- but i don't have those files, i have -> file:///C:/Users/Febrizio/Documents/Mapping_Project/Project/bismillah/6/37/37.png
so my html loads png that i don't have,
it makes the page going blank if i load that..
what's wrong? did i generate wrong png's?
That should be easy enough to address. Basically the map is requesting a tile that you've not generated with TileMill.
ReplyDeleteYou can address this in two ways:
- you generate the missing tiles
- you change the center coordinate of your map
Your map is probably centered in the wrong place or you've generated an incomplete or incorrect set of tiles.
Both keys "6/38/27" and "6/38/37" represents valid tiles requests. You can check them here:
http://a.tile.openstreetmap.org/6/38/27.png
http://a.tile.openstreetmap.org/6/37/37.png
Meaning: z/x/y (z = zoom level. 1 furthest way)
thx for your reply, but how can i decide the right center coordinate of my map?
DeleteAfter declaring the map do something like:
ReplyDeletemap.setView(new L.LatLng(, ), );
To get the actual coordinates, go for example to Google maps, right click somewhere and use the "add lat/lon marquer"
ex:
Deletemap.setView(new L.LatLng(-3.5,120),6);
Sorry Pedro,,
Deleteit still doesn't work for me.. :(
what's wrong?
i have modified your source code with my tile location, but it still doen't work..
can you please take a look at my code?
here's the link:
http://bunesia.com/tilemill
it can't load the tile...
thx before for your help...
and here's the directory tree
Deletehttp://img15.imageshack.us/img15/9494/75542193.jpg
thanks for your help pedro...
Deleteit all works now, i've found the solution.. :)
thanks a lot..
Febrizio, mind sharing with us about what was your solution? We have the same issue.
ReplyDeleteThe line
ReplyDeletemb-util --scheme=osm Freguesias.mbtiles Freguesias
Should now be
mb-util --scheme=xyz Freguesias.mbtiles Freguesias
With the new version of MBTiles which uses the more common term.
Thanks!
Thanks for the info Tom.
ReplyDeleteI'd like to divert from your approach where you extract the PNGs from the SQLite database. Instead, I'd like to retain the SQLlite database and have it sit underneath tilestream (see project at https://github.com/mapbox/tilestream). I can successfully access my map by submitting a URL to the tilestream server, e.g. http://192.168.1.25:8888/map/John_test1 (John_test1.mbtiles is my exported SQLite database); however, when I do not seem able to generate a map when I try to referenced the tile stream server in a page such as:
ReplyDeletevar map = L.mapbox.map('map');
map.addLayer(L.tileLayer('http://192.168.1.25:8888/map/John_test1/{z}/{x}/{y}.png'))
...
If you know how to properly reference a SQLite database via a tile server and have it appear using Leaf, that would be very helpful. There does not seem to be a definitive statement on how to accomplish this anywhere.
Hi Pedro, Really nice Post,
ReplyDeleteAn easy question. Is it necessary to have an Web server running to load the Tiles?
Thanks
Hello Pedro!
ReplyDeleteReally nice post.
As you I need to use mb-util in a windows environment (I work with ArcGIS) and I'm having troubles using mbutil with cygwin.
I installed cygwin with all necessary packages, I installed mbutil and I have the next problem.
When try to execute any mb-util command I have no response, only a blank line....
Have you any idea why this can be happening?
Muito obrigado
Hi,
DeleteThere's actually an easier way:
http://gis.stackexchange.com/questions/50646/is-there-any-way-to-use-mbutil-on-windows
Just check the accepted answer
Hi Blogger,
ReplyDeleteI want to display map with custom tiles as you mentioned in this blog i followed everything to render my tiles.How to render google map along with my custom tiles.please help me out
Hi Guys,
ReplyDeleteJust wondering whether you would be able to help with this, I have export my tiles (with mouse hover labels using teaser template) using TileMill.
and after the export I checked my preview and I can see those labels when I hover my mouse.
However mouse over text doesn't appear in google maps .... all the other tiles are working perfectly except the tooltip text
Am I doing something wrong here?
I finally found great post here.I will get back here. I just added your blog to my bookmark sites. thanks.Quality posts is the crucial to invite the visitors to visit the web page, that's what this web page is providing.
ReplyDeletestate employee cashless treatment scheme
Get answers to your questions here
ReplyDeleteglobalemployees
globalemployees
GlobalEmployees