
In my previous post I've developed a working Canvas TileLayer for Bing Maps. Since then I've enhanced that code and packaged it inside a working Bing Maps Module, adding some new features in the process.
This post is going to be very "demo driven", and I'll show how to use the module with all of its variants. All the demos in this post are included with the module package.
Note: If you want to read a little bit more about Bing Maps Modules you should check http://bingmapsv7modules.codeplex.com, which also includes a catalog for several modules out there.
Update 20/04/2013
This module has been added to the bingmapsv7modules project: https://bingmapsv7modules.codeplex.com/wikipage?title=Canvas Tile Layer Module
Basic usage:
As any other module, you should register and load it. This is done after loading the map and the boilerplate code is like this:
        var MM = Microsoft.Maps;
        var map = new MM.Map(document.getElementById("mapDiv"), {
            credentials:"MAP CREDENTIALS HERE"});

        MM.registerModule("CanvasTileLayerModule", "js/CanvasTileLayerModule.js");
        MM.loadModule("CanvasTileLayerModule", {
            callback: function () {
                new CanvasTileLayer(map,
                        {
                            drawTile: function(canvasContext, tile) {

                                //CANVAS DRAWING HERE
                            }
                        });
            }});
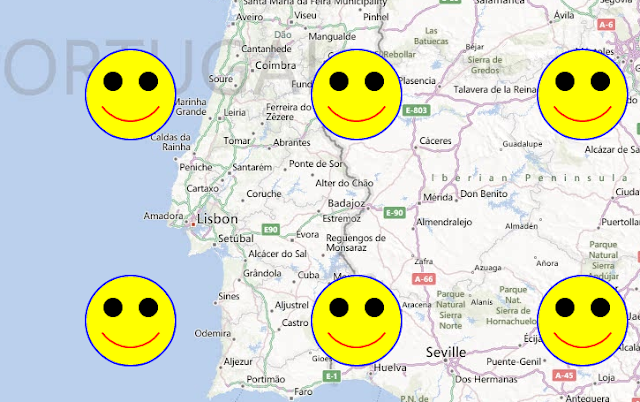
The module is registered and loaded. Then, after being loaded, a CanvasTileLayer is created by passing the map itself as an argument and some additional options. The only mandatory property is the "drawTile", which is where all the custom tile drawing will occur.Let me show a simple example. I'll draw a smiley face on the center of each tile. So, I'll basically fill the custom drawing section with this code (taken from: http://talkaboutstuff.hubpages.com/hub/HTML5-Canvas-Creating-a-smiley-face-with-the-ARC-API)
    // The Face
    context.strokeStyle = '#0000FF';
    context.fillStyle = '#FFFF00';
    context.lineWidth = 4;
    context.beginPath();
    context.arc(120,120,50,0*Math.PI,2*Math.PI,true);
    context.closePath();
    context.stroke();
    context.fill();

    // The Smile
    context.strokeStyle = '#FF0000';
    context.lineWidth = 2;
    context.beginPath();
    context.arc(120,110,40,0.2*Math.PI,0.8*Math.PI,false);
    context.stroke();

    // The Left eye
    context.strokeStyle = '#000000';
    context.fillStyle = '#000000';
    context.beginPath();
    context.arc(100,105,10,0*Math.PI,2*Math.PI,false);
    context.closePath();
    context.stroke();
    context.fill();

    // The Right Eye
    context.strokeStyle = '#000000';
    context.fillStyle = '#000000';
    context.beginPath();
    context.arc(140,105,10,0*Math.PI,2*Math.PI,false);
    context.closePath();
    context.stroke();
    context.fill();
Online demo
Debug Mode
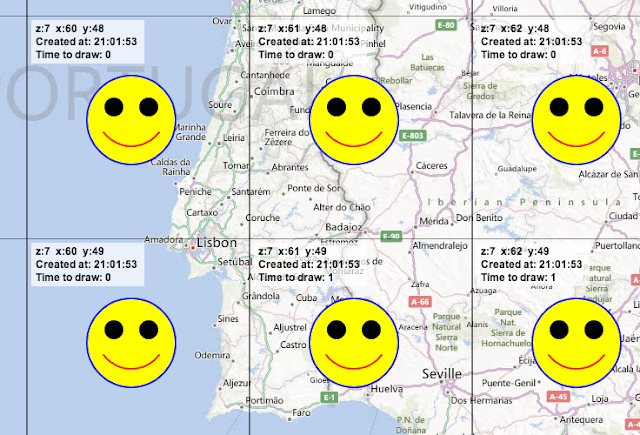
Besides the drawing callback ("drawTile" parameter) the module also supports a "debugMode" property. Let's try it on the previous example.
    var MM = Microsoft.Maps;
    var map = new MM.Map(document.getElementById("mapDiv"), {
              credentials:"MAP CREDENTIALS HERE"});

    MM.registerModule("CanvasTileLayerModule", "js/CanvasTileLayerModule.js");
    MM.loadModule("CanvasTileLayerModule", {
        callback: function () {
                      new CanvasTileLayer(map, {
                           debugMode: true,
                           drawTile: function(canvasContext, tile) {

                                //(...)
                           }
                      });
    }});
Online Demo
When turned on (it's off by default) shows each tile boundary and some additional info like its z/x/y, the time it took to render, and when the tile was generated (useful for caching purposes). Should be pretty helpful during development.
Drawing Georeferenced Data
So, drawing ungeoreferenced data (like the smiley above) is nice and all, but limited to a certain range of scenarios (like drawing watermarks, grids and stuff). For the georeferenced data we've got to make some calculations to determine the position, relative to the tile canvas, were to draw. Thus, I've included in the callback a little bonus: a "tile object". It includes some properties and functions that should help in the drawing process:
- x: the tile x index
- y: the tile y index
- z: the tile level of detail, or z index
- pixelCoordinates: the pixel coordinates (not viewport based) of the top level coordinate of the tile
- getLocationPixelOffset(location): function that converts real coordinates to canvas coordinates.
- metersPerPixel: current resolution of the tile in meters per pixel
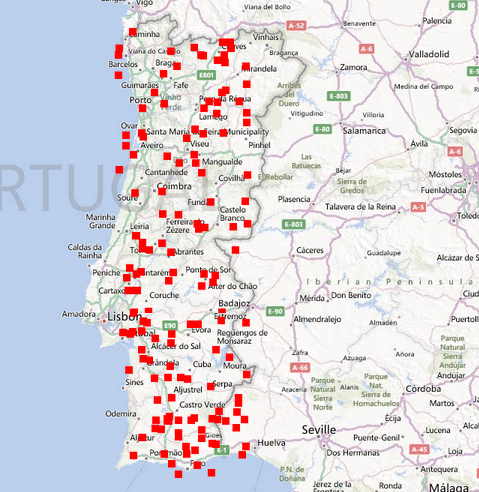
For this example I'll use a sample data of 150 coordinates in Portugal and I'll draw a small square for each coordinate on the map. The drawTile function will be:
    drawTile: function(context, tile) {
    for (var i = 0; i < sampleData.length; i++) {

        //where all the magic exists
        var canvasPixel = tile.getLocationPixelOffset(sampleData[i]);

        var squareSize = 10; //in pixels

        //(optional, just to improve performance)
        // don't draw coordinates outside of the tile,
        // taking into account the square size
        if(canvasPixel.x < 0 - (squareSize / 2) ||
           canvasPixel.x > 256 + (squareSize / 2) ||
           canvasPixel.y < 0 - (squareSize / 2) ||
           canvasPixel.y > 256 + (squareSize / 2)) {
            continue;
        }

        context.fillStyle = "red";
        context.fillRect(canvasPixel.x, canvasPixel.y, squareSize, squareSize);
    }
Online Demo
Caching
I've also included a "useCache" parameter when building the Canvas Tile Layer. It's off by default because it depends on jscache. Thus, if you turn on this parameter, you need to include it in your page (its a small .js file, with MIT license). Anyway, if you can, always use the cache option because the generated tiles are not cached by the browser. The cache parameters are:
- cacheTiles: bool (false, by default)
- cacheTimeout: int (60 seconds, by default) - The amount of seconds for a cache item to expire. Note: this cache uses a sliding window, so each time a tile is fetched the cache timer is reset.
    var MM = Microsoft.Maps;
    var map = new MM.Map(document.getElementById("mapDiv"), {
              credentials:"MAP CREDENTIALS HERE"});

    MM.registerModule("CanvasTileLayerModule", "js/CanvasTileLayerModule.js");
    MM.loadModule("CanvasTileLayerModule", {
        callback: function () {
                      new CanvasTileLayer(map, {
                           cacheTiles: true,
                           cacheTimeout: 300,
                           drawTile: function(canvasContext, tile) {

                                //(...)
                           }
                      });
    }});
Then use the debug mode to confirm that the tiles are indeed being fetched from cache and not regenerated on the fly.Additional Demos
The following demos are not related to any specific feature of the module and are just included as a proof-of-concept.
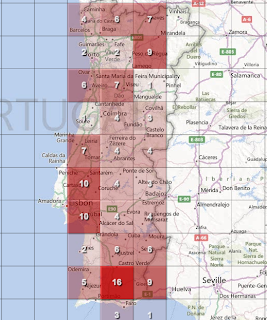
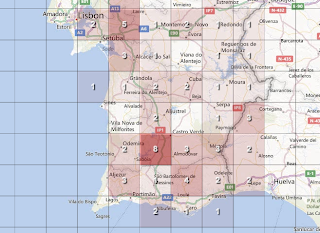
Demo #1: Basic Clustering
This demo uses a simple clustering technique were each tile is segmented into 16 squares and each one shows a different color and number to represent the amount of coordinates inside it. Better shown than said, this is the cluster for the same sample data of the previous example.
Online Demo
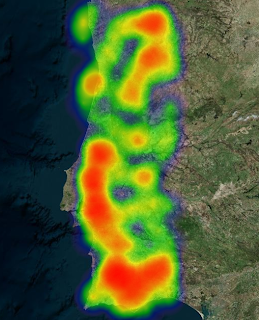
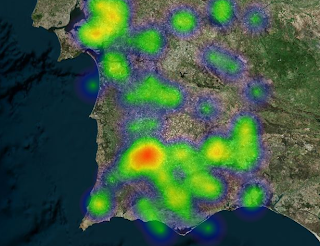
Additional Demo #2: Heatmap
Also with the same sample data, this module can be used for more complex stuff, like a heatmap.
Disclaimer: the Heatmap drawing code was taken from the Client Side Heatmap Module from Alastair Aitchison. All credits go to him.
Online Demo
You can download the module and all its demos here.
I'm glad I found your blog. First I was drawing everything with pushpins, then I read your article on the HTML5 canvas and switched to that for my zoomed out views. Today I rewrote everything again but using a tile layer, although I decided to render my tiles on the server. Thanks for the great articles! qommnd.com is the website if you want to see the tiles in action.
ReplyDelete